Screen Control & Modeling
Screen control
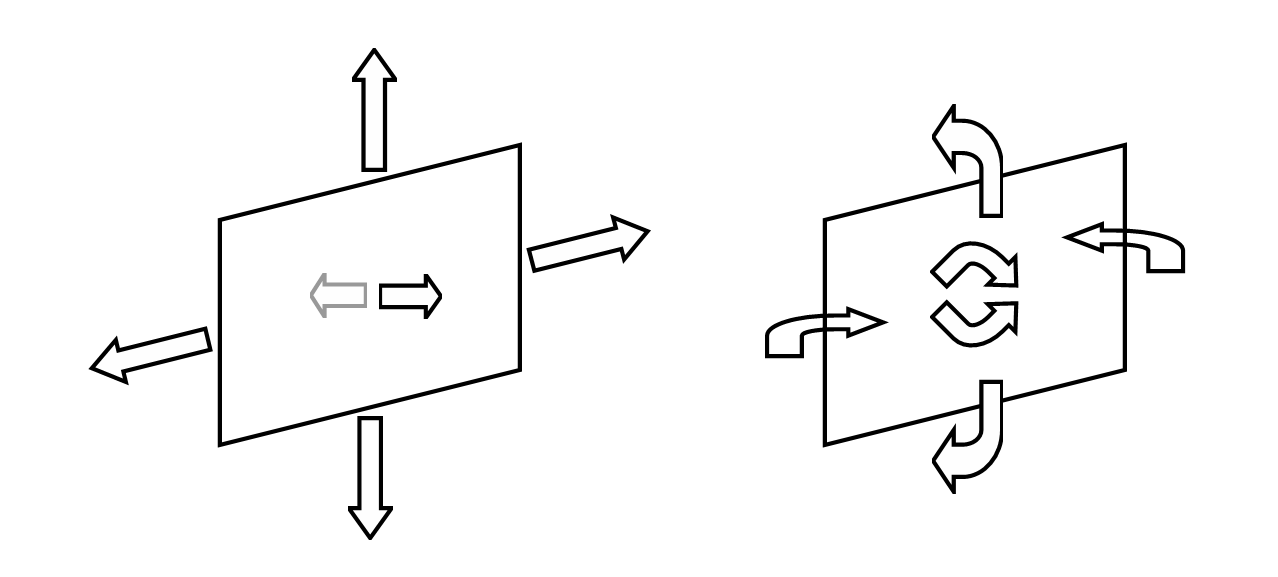
So you started the program. Now imagine that you view your model through a screen. You move through your 3D model by moving the screen, using the twelve buttons of the ‘Screen control’ panel on the right. There are six buttons to shift the screen, see the left-hand picture below, and six buttons to rotate the screen, see the right-hand picture below.

For example the ‘UP’ button corresponds with the arrow pointing up in the left-hand picture and will move the screen upwards (so the model looks to be going down), and the ‘PUSH TOP’ button corresponds with the curved arrow at the top of the screen in the right-hand picture and will tilt the screen by pushing at the top.
Just choose the ‘Reset viewpoint’ menu item in the ‘View’ menu if you are lost in 3D space and want to return to the initial viewpoint.
The properties file
Because The Tree Project in its current form shows wireframe models, we just see a bunch of lines on the screen. If all lines are of equal thickness and color, there is no way of telling which lines are closer and which lines are farther away. Now, for shapes that are well known, such as a cube, the human mind recognizes these shapes and kind of infers which lines are closer and which lines are farther away. However, this does not always work. So what The Tree Project does, is to reduce the width of the lines and fade to the background color as they get farther away.
The width reduction factor and the fade to background factor are some constants >= 0. Value 0 means no width reduction or fade to background effect at all. The larger these values get, the larger the effect. I found that a good value for the width reduction factor is 0.5 and a good value for the fade to background factor is 0.1.
You set these properties in the configuration file called ‘properties.txt’ in the ‘config’ directory.
The configuration file also allows you to set the background color, the pen width (the width of the wireframe lines were there no width reduction) and the pen color (the color of the wireframe lines were there no fade to background).
Creating your own wireframe models
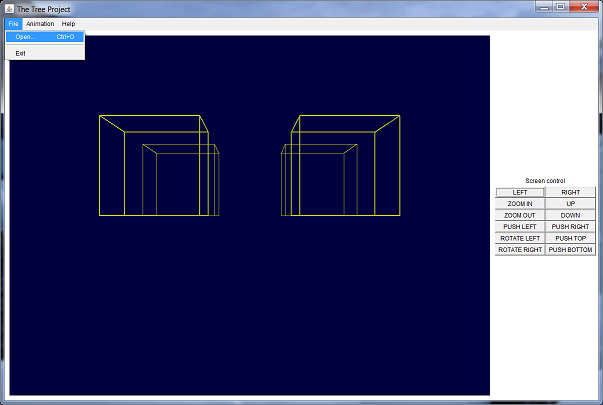
By choosing the ‘Open…’ menu item in the ‘File’ menu you can read other tree files. A tree file contains a model.

The first time that you choose ‘Open…’, the ‘trees’ directory is shown, but of course you can put your tree files anywhere you want.
To define a model, you create a set of nodes and a set of branches to
connect the nodes.
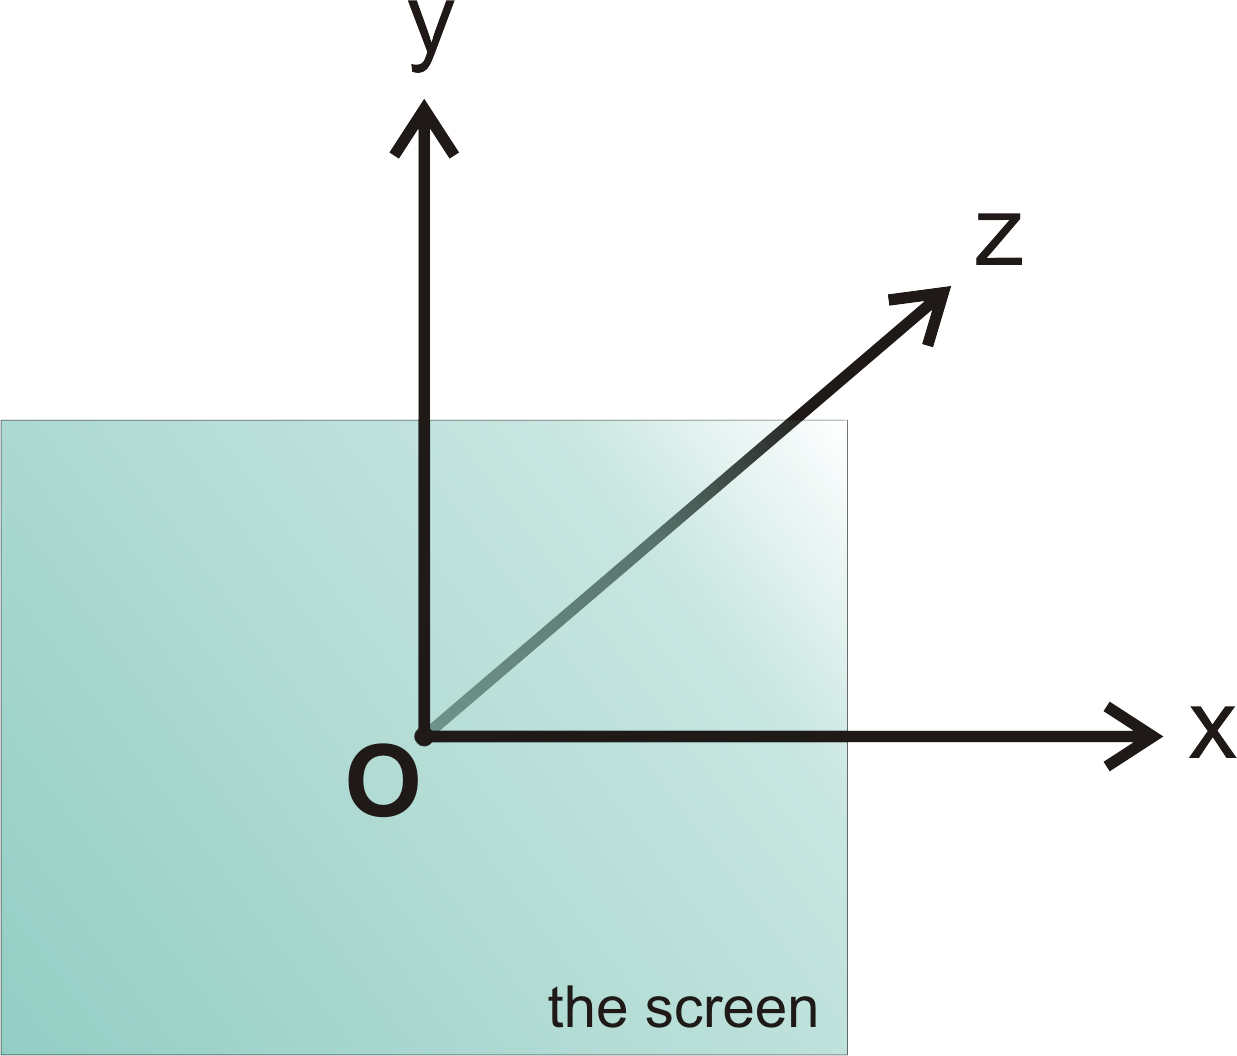
Each node has an x, y and z coordinate in 3D space.

The picture above also shows the start position of the screen through which you view a model.
Now, a tree file contains all the definitions for the nodes and branches that make up a model. Actually, a tree file is a file that conforms to a set of simple rules:
- it is a plain text file;
- the [NODES] token indicates that the lines hereafter contain node definitions (zero, one or more nodes can be defined);
- a node definition has the form nodeName nodeX nodeY nodeZ with nodeName the name of the node and nodeX, nodeY and nodeZ the x, y and z coordinates of the node respectively;
- nodeName can be any string and nodeX, nodeY and nodeZ must be floating point numbers;
- the [BRANCHES] token indicates that the lines hereafter contain branch definitions (zero, one or more branches can be defined);
- a branch definition has the form branchName nodeP nodeQ with branchName the name of the branch and nodeP and nodeQ the end points of the branch;
- branchName can be any string and nodeP and nodeQ must be the names of nodes that have been defined earlier in the file;
- a surface definition has the form: [SURFACE] color orientation p*
- the [SURFACE] token indicates the start of a new surface;
- color is the color of the surface and for 0 ≤ red ≤ 255, 0 ≤ green ≤ 255 and 0 ≤ blue ≤ 255 its value is 65536 * red + 256 * green + blue, it must be an integer in the range from 0 to 16777215;
- orientation is the orientation of the surface and should be either NEGATIVE or POSITIVE
- p* are zero, one or more nodes that make up the polygon of the surface and must be the names of nodes that have been defined earlier in the file;
- whitespace is used as the delimiter pattern (a space, a tab, a new line, or any combination);
- the [NODES], [BRANCHES], [SURFACE], NEGATIVE and POSITIVE tokens are case insensitive;
- comments are preceded by an exclamation mark, the remainder of the line after the exclamation mark is considered to be a comment.
For example, the file ‘pyramid.ttp’ in the ‘trees’ directory is a valid tree file:
! pyramid: first define the base nodes, second define the apex node

! p = pyramid
! n = node
! b = branch

[NODES]
! nodeName  nodeX  nodeY  nodeZ
  pn1      -250.0    0.0 1000.0
  pn2       250.0    0.0 1000.0
  pn3       250.0    0.0 1500.0
  pn4      -250.0    0.0 1500.0
[BRANCHES]
! branchName  nodeP  nodeQ
  pb1         pn1    pn2
  pb2         pn2    pn3
  pb3         pn3    pn4
  pb4         pn4    pn1
[NODES]
  pn5         0.0  500.0 1250.0
[BRANCHES]
  pb5         pn1    pn5
  pb6         pn2    pn5
  pb7         pn3    pn5
  pb8         pn4    pn5
As you would expect, when you read this tree file using ‘Open…’ you will see a pyramid.
Note that things become complicated very easily. Use ‘Open…’ to read the tree file called ‘city.ttp’. Although more impressive than a simple pyramid, note how cluttered things become when using wireframe models. Also try to open this file in a normal text editor and see how complex the file is! This calls for new features:
- Display of solid objects instead of wireframe models;
- Provision of an easy to use graphical editor instead of having to edit a text file;
- Possibility to use the mouse to travel through a model.
If you think about these features, you will soon realize that these are major tasks. But you can display 1 solid object with the current version of the software. Continue reading to learn more…
Surfaces
At this point we are able to render a single object composed of surfaces as long as the object is convex. This means that if we travel in a straight line from one point on the object's outer surface to another point on the object's outer surface, we stay inside the object.
In the paragraphs above we outlined how to create a tree file, but in the
example we focused on nodes and branches only. Now we will focus on
surfaces.
An example of a surface definition is:
[SURFACE] 1996830 NEGATIVE n1 n2 n6 n5
The number 1996830 is the color, the word NEGATIVE is the orientation and n1, n2, n6 and n5 are the nodes of the surface's outer polygon.
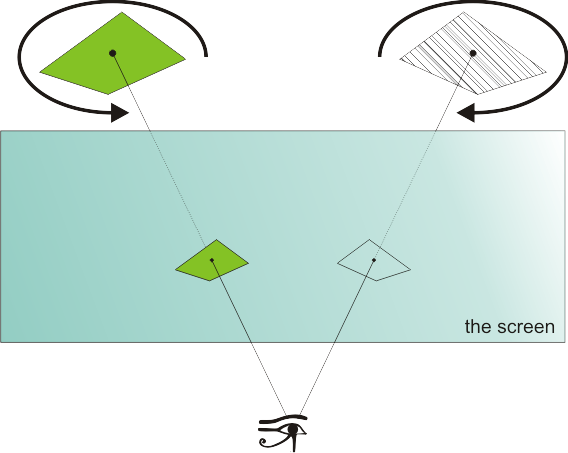
Some clarification is needed for the orientation. The orientation tells the software whether we are looking at the visible side of the surface or not (we only display one side, the other side is on the inside of the object). By definition, if we follow the order of the projected nodes, then the surface will be visible if and only if either we make a counterclockwise movement when the surface has NEGATIVE orientation or we make a clockwise movement when the surface has POSITIVE orientation.
Taking the example surface above:

On the left we are looking at the visible side of the surface. The arrow
follows the nodes going from n1 to n2 to n6 to n5. Note how the projected
nodes follow the same counterclockwise movement.
On the right we are “looking” at the flip side of the surface and
the movement of the projected nodes is now reversed.
For an example of a complete object choose the ‘Open…’ menu item in the ‘File’ menu and choose the ‘greencube.ttp’ tree file from the ‘trees’ directory. This shows a cube of which the surface in the example above is one of its sides.